
At a recent Claris FileMaker User Group MN (FMPUG-MN) meetup, a successful business owner demonstrated the features of his custom app built on the Claris FileMaker low-code/pro-code platform. He also discussed all the business value his solution has brought him, and the advantages he’s gained by building a custom app versus using an off-the-shelf solution.
At our FMPUG meetup the following month, we did a deeper dive into this business solution. Learning from two of the developers who had worked on the project, we were able to look at the solution behind-the-scenes. We watched as the developers demoed how they built the solution, and we learned how we can all capitalize on some of the amazing features they’d built in.
Their presentation included discussion about two business solution catalysts: fmIgnite and fmFlare, and how they work together to create a brilliant, full-featured FileMaker solution while saving thousands of hours of custom coding. Even in a low-code solution that allows for fast changes, the addition of pro-code modules from BrilliantHub and BrilliantConnect are able to move things forward quickly, making complex FileMaker solutions much more affordable and achievable.
Here’s a quick overview and summary of some of the main points:
The ability to flexibly map routes was key for this service company. Andy first talks in detail about GIS and mapping capabilities in the FileMaker solution that fully integrates with all other FileMaker data in the solution:
- Maps are created using BrilliantConnect in a card window that pops up and does all the heavy lifting code work behind the scenes.
- He shows several different mapping libraries and advanced functions such as drawing area bounding boxes and getting specific parcel data.
- Also mentioned are GeoJSON, Esri, etc.
Shawn then discusses the overall structure of BrilliantHub. He begins with the anchor-buoy relationship graph design.
Next, Shawn demonstrates the BrilliantConnect integration with regards to some of the more advanced features in the application such as:
- Email sending with Mandrill, MailGun, or Sparkpost
- Text message sending with Twillio
- A Javascript enabled calendar
- Data table columns
- and more.
Watch the video:
—
Read the unedited transcript of the video below:
Tim Cimbura: The prologue, I just used all “p” words, prologue presentation pizza in person. Intentionally. I had to think of a “p” word that would be the start or the beginning. The other ones just fell into place. Yeah. Preview.
So, just as a quick intro, last month, we had Nick Holland, who is the business owner of Peregrine Pest control, demo his FileMaker solution … that is a custom FileMaker solution. At that time, we didn’t know he was going to take the entire hour to do his demo. But he really went into full depth on that and it was really good. So I posted that at this link, if you haven’t got a chance to see that.
And today’s presentation will be by Shawn Krueger and Andy Walz, who are two of the developers who worked on this solution. They’re going to demonstrate kind of the behind the scenes of it. So how was developed and how it works under the hood.
This is a photo of where we are today at LuminFire. If you’re not here, in person, this is the building. This actually is a drone video, so it gets really cool here. It’s not live though. Yeah. So I’m going to stop sharing my screen.
Andy Walz: Alright. So without going back to the Peregrine file, hopefully you had a chance to see that or watch the video, I’m going to just reintroduce a product we have called fmFlare that is used to drive a lot of the more advanced functionality that you saw in that that demo last last month. Things like the maps, the calendars, the emails, it sends the text messages. We have built up modules for functionality like that using services like Twilio, Ezri, ArcGIS, Mailgun, and a whole number of third party service providers that we get asked to integrate FileMaker with all the time.
And we’ve built modules for that in this solution called fmFlare. It’s a FileMaker file. No plugins. It’s all native functionality. There’s probably 1000s of insert from URL, skip steps in this file. And what we’ve done is made it maybe 10s of 1000s. I know what we’ve done is made it super easy for ourselves and other developers to use fmflare integrations by just setting up script parameters and script call from your solution, that proxy through fmFlare and fmFlare knows how to communicate with all these third party providers and fmFlare will return results. It will either return the data you’re asking for, or it will return HTML that you can display. In a web viewer in your own solution, I’m going to get into that more in a minute or, or it will display content in a web viewer or a card window with a web viewer. So you can even very quickly add advanced functionality to your solutions without even making layouts or things like that. So what we’re going to look at, what I’m going to demo today is all going to be out of our examples file. And we package this along with fmFlare, and this file is completely open so you can look at all of the scripts to do whatever it is that you want to, to do to integrate with. And you can copy and paste these scripts into your solution, and then modify them so that it uses your data instead of the example data. But for testing, we’ve made layouts here that allow you to just enter some sample data and send requests and see what you get back. And it really aids the development process.
What you’re going to find here, say for example, for MailChimp, like the things that we’ve been asked, that most people commonly want to do with these solutions. And we focus on that first, like what our customers are asking for, not necessarily making sure that we have examples for every single function in an API. But you can get a long ways with what we’ve got here and avoid having to write all those scripts yourself.
So today, I’m going to focus on maps and show you the mapping flare that we’ve been working on for a number of years now. And then Shawn is going to take over and talk about email and calendars, and possibly a few other things you saw in Peregrine and how they, how you could use them through here.
And we do give away a basic version of fmFlare for free. And then it’s licensed for the more advanced functionality based on how you’re going to use it and how many people are going to use it and things like that. But it’s priced in such a way that it can save you a lot versus custom development yourself.
So for geotag, GIS geographic information systems, and we also do address verification, zip code lookup, USPS address formatting or local geocoding, which is converting an address to latitude and longitude. That type of functionality is in here, too, you may have seen the address lookup in the Peregrine solution. That one, as is, it’s like a type ahead. And so it’s actually looking for matches as you type in an address. And then you click on the matching address, and it fills in the rest of the form for you. fmFlare has functionalities that can help you build some of that. That one does require a little more schema in your own solution because it uses value lists and things like that.
But anyway, today I’m going to show you maps. So I’ve got a number of examples here. Well, let me just start with a new record. So what you can do here is quickly build maps to map a single point or map multiple points. I’ve demoed some of this in the past, it was probably over a year ago. But some of you might remember. You can pass in data as a FileMaker list, or as geoJSON, which is just JSON, but an agreed upon standard format of JSON. If you Google geoJSON, there’s documentation on the web that shows you exactly how to format it. And if you’re wanting to map a lot of data, with a lot of properties, it’s the way to go. And you can build it using file makers native JSON functionality, or I like to use the data API script step as well, because you can get, you have to massage it a little bit. But you can get JSON and convert it to geoJSON, and really quickly map lots of data that’s in your solution. And then the newest feature is ArcGIS data, which is what I’m going to spend the most time on today.
So but just to give you an idea, St. Paul is somewhere around there. And you can enter a zoom level, if you want to return the web, your source to your solution and map it in your solution. Here is all of this data is just setting up a script parameter. And depending on what that parameter looks like, you’re going to get, one map or the other. So, you can choose. We’ve got a base map library here. So you can, some of these require an API key, but a lot of them don’t. And so you can, you can do one or more base maps, with different layers. There’s a lot of functionality here. And just to just to show you what’s happening behind the scenes, we were really just taking the data in these fields, setting it to variables, and then building a script parameter.
We’ve got examples of every key and value that’s supported. So I have pasted it in here for convenience. So if you’re working with this yourself, we give you an example like this, and this is one of our more complex ones, I mean, you might be passing in an API key and some data. But this one takes all sorts of different kinds of options for setting up the map, like how it behaves, what it’s centered on, whether you have what’s your starting zoom level is, what type of data you want to map. And these are not all required, you don’t have to pass all of these every time if you just want a simple map, you’d be passing like a handful. If you’re mapping data, and you want popovers, lots of different settings supported for that.
Searching is now supported. There are lots of different options for that, like what happens when you click on the search result. And base maps, you can, do one or more credentials for different services. And most recently, you can also now draw your own features or place your own points on the map. If you want to have your solution, somebody to be able to choose a location and have FileMaker track that and all fmFlare examples work this way. So again, this is mostly just for testing purposes, and you would take a script like this and put it in your own solution and pass the parameters to get the result you want.
So I prepared a number of examples but I’m going to start with a little thing that most people don’t know about. And that’s that there’s a lot of GIS spatial data available on the worldwide web for free. And there is a company called Esri, whose CEO is actually a University of Minnesota graduate. They’re the leading software and service provider in the GIS space. And their main product is called ArcGIS. And it is, like FileMaker, it’s a desktop platform, a web platform, a mobile platform, they have all they cut, they span the gamut. The whole package is very expensive but they have an online version that’s actually quite affordable. And so we have a number of clients using ArcGIS Online to store their own spatial data, and to have fmFlare communicate with that to make maps or to do spatial processing in FileMaker. But a lot of government agencies, cities, natural resource departments, things like that, they’re all going to, most of them are using Esri. And so it was important for us to integrate with that. And what you’re going to find is that more and more of these agencies are giving away data for free. And because we make it easy, they’re even providing the data as web services that you can consume on the fly. And so I’m going to show you just how easy that is.
So last night, I was Googling to find some examples. And some keywords when you’re searching, or just open GIS data. Like the location, you want to find counties, a lot of this is managed at the county level, so that’s a good place to look. Or there are state and federal agencies, the Census Bureau has a huge set of data they call TIGER, and you can pull in demographic information and match it with your existing contacts and your FileMaker CRM, just to throw out a few examples.
What you’re gonna find is a lot of these GIS portals, if you look up here, you’re gonna see. They’re in the Esri shop that’s driven by ArcGIS. And they have a bunch of data of different types here. What are you interested in? What might augment your existing FileMaker solution? Parcels we get asked about a lot, because parcels tie closely to addresses not always exactly, but parcels contain information about like, property value, tax, ID number, tax information, boundaries. We were working with some city government clients that do permitting or code violation tracking or public works and parcels that, they have to mail postcards to everyone within 500 feet of, a project that’s dig that’s got to happen or when someone applies, if you’re going to do rebuild your garage, and but you need a variance because it’s too close to the street or something like that, you have to notify all the neighbors, that kind of thing is can be accomplished if you have, parcel data that augments what’s already in your, in your CRM so you hone in here and you look and ArcGIS provides, this link right at the bottom that says I want to go here let me zoom in.
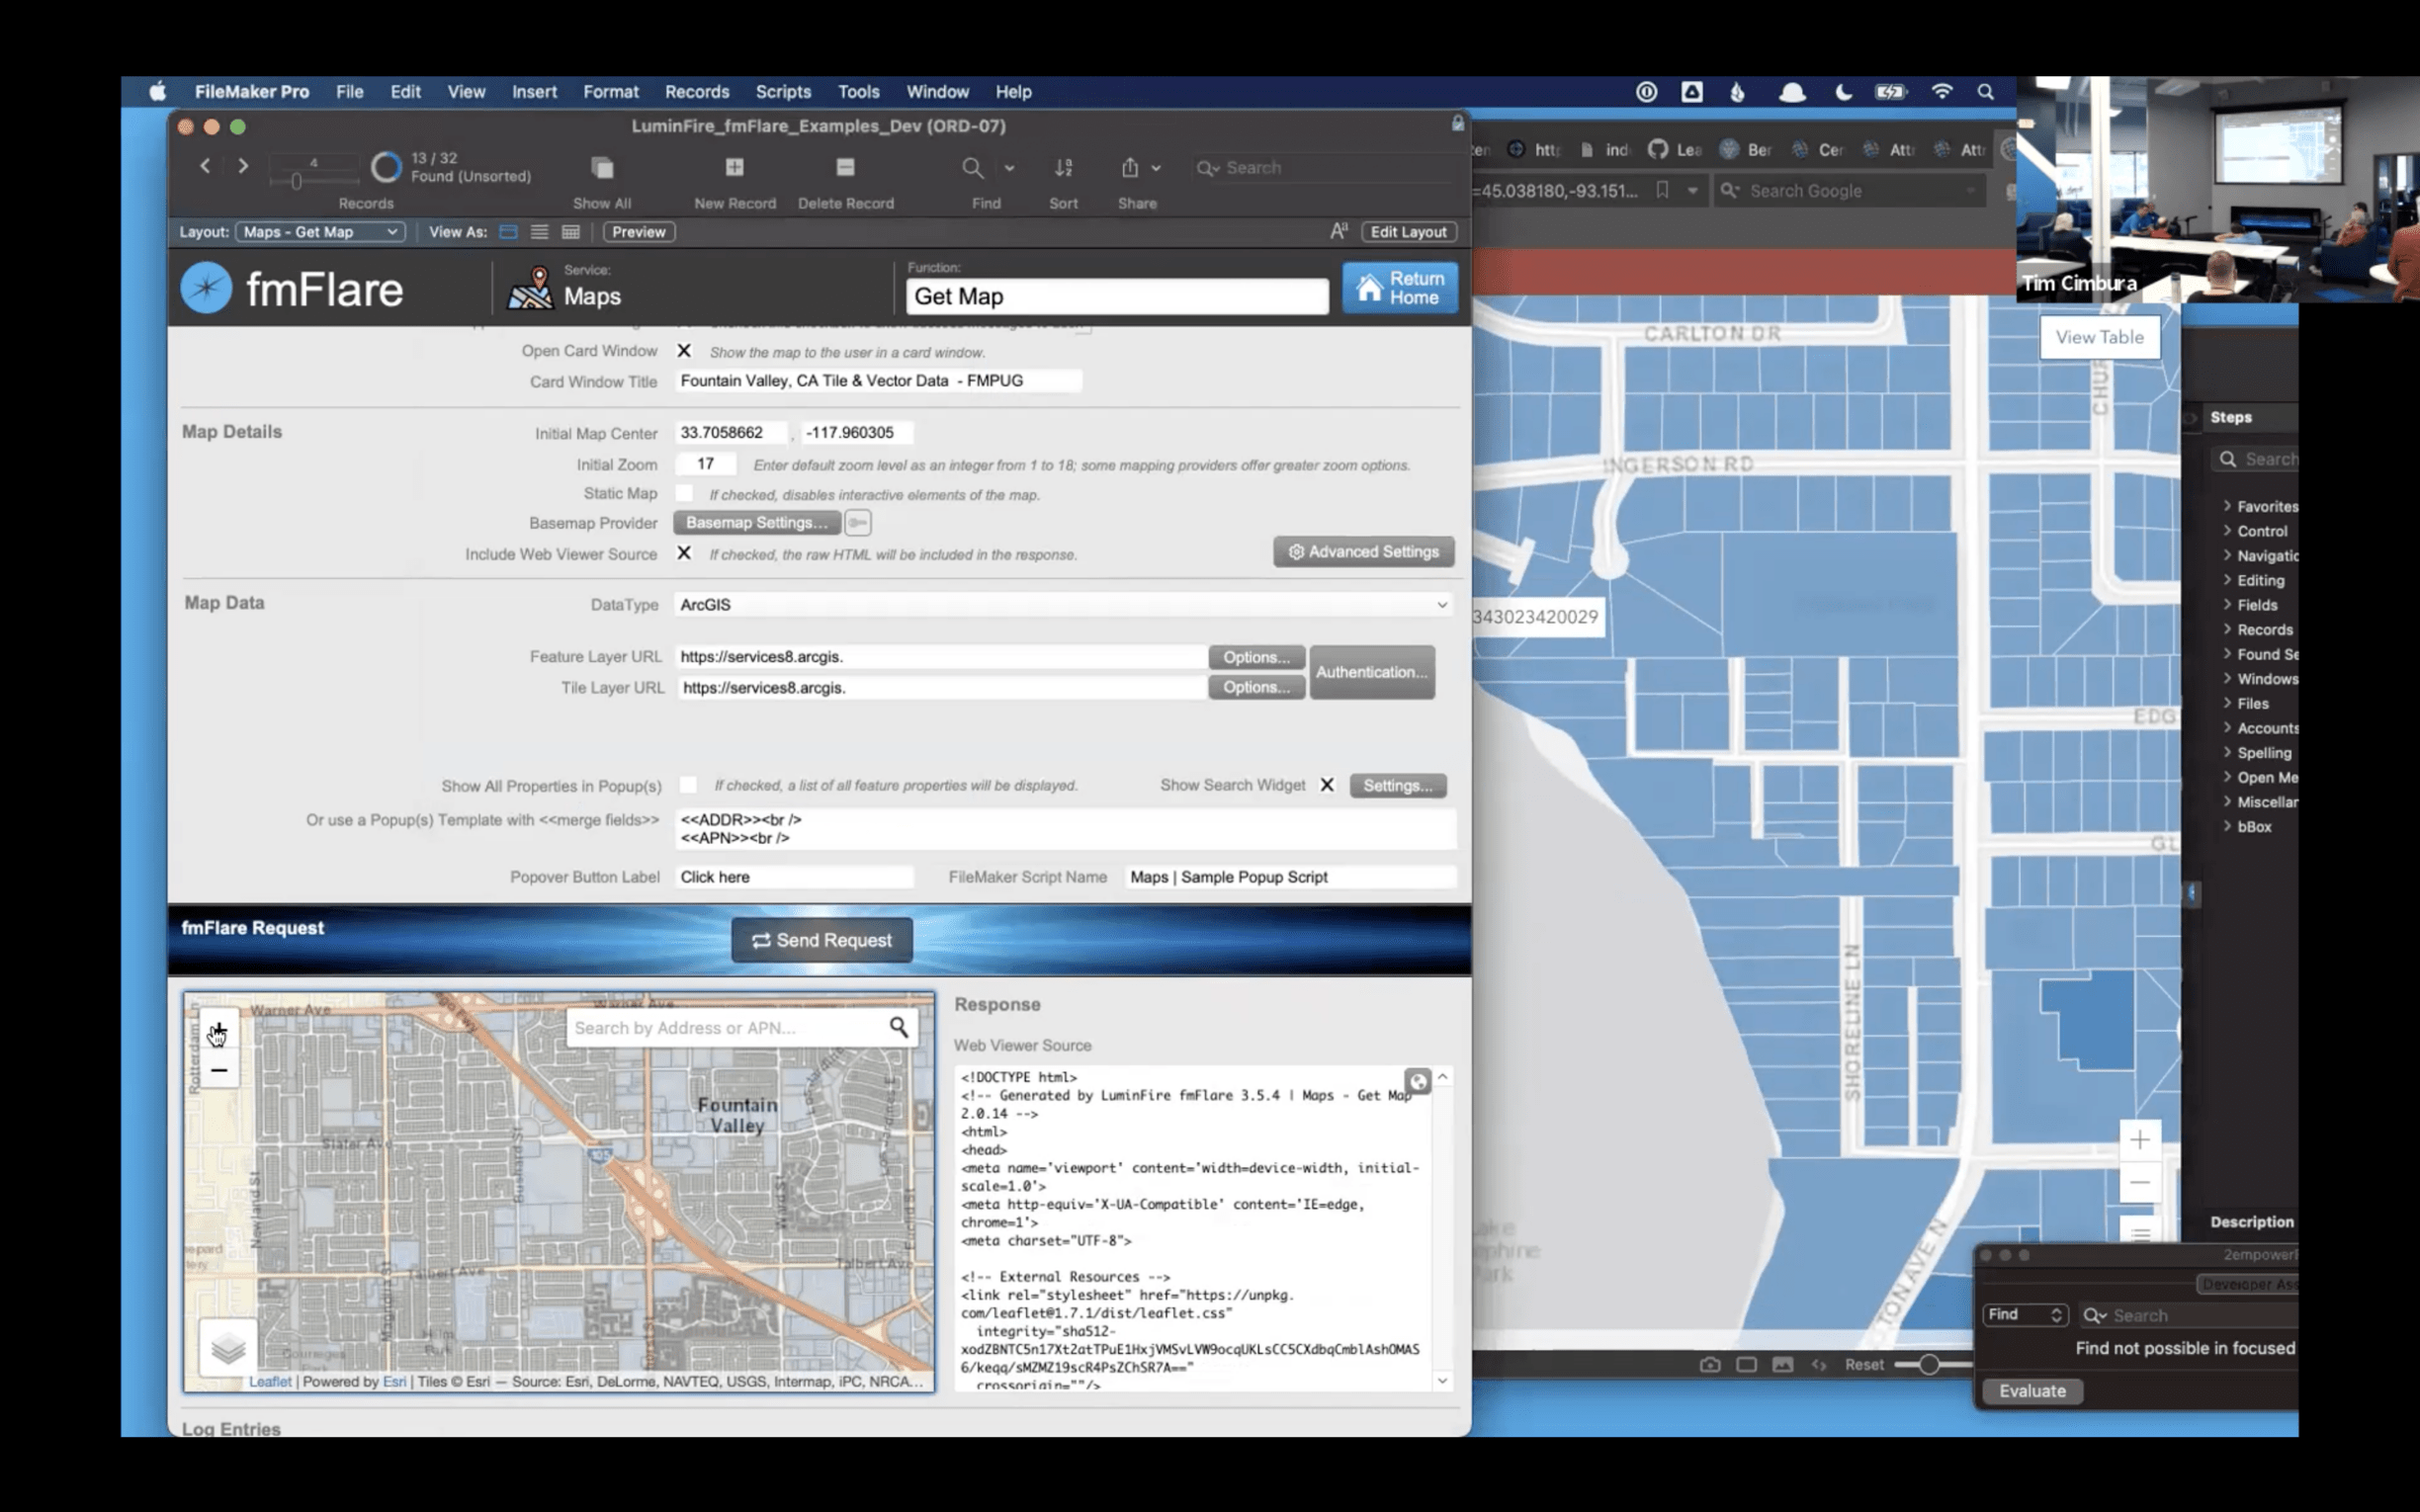
There’s so much data here It can’t map it to the zoom in there we go. And you can see by clicking on it, what kind of information is tracked. School this district’s tax info, building size, square footage, political districts and things like that, that could we’ve used, we’ve used GIS data, for example, to help nonprofit clients understand their supporters better, like where do their supporters live? And how could they target other supporters that live in similar type, districts or neighborhoods or things like that, or who, when you’re trying to do campaigns, and you need people to contact legislators, like, Who are your contacts legislators, you can get that kind of information from GIS data and cross reference it with your contacts. But to keep going here, you’re going to see a link called I want to use this one in, in ezri, ArcGIS Online, and then you can view API resources. And it’s going to give you links to use this data real time. And so there’s two formats here, a service and geo JSON. And I mentioned that earlier that geo Jason is a standard, structured form of Jason for spatial data. and fmFlare supports both of these. So you can copy a URL, this one’s going to be huge. I think I’ve got an example of a smaller one over here. I’ll show you this one as a service. I know from working with parcel data, it will be a lot slower to render a map with geo JSON for parcel data, then it will be for a geo service. So I can copy this URL, create a new record here. And let’s go like that, and choose ArcGIS. And now, there’s two types of data that you can get from ArcGIS vector data and raster data, which they label as feature layer, or tile layer. So feature layer is going to be vector data like this that’s made up of points that form polygons, or just points or lines. And that data scales as you scroll in and out. Whereas tile data is like base maps, or, your rasterized data. And that might be used for mapping weather radar, or fire, smoke or, anything that’s Yeah, those are some things that are more appropriately represented as raster data where it’s continuous and not discrete features like this. So um, but we can do either one, we paste it in here. Sometimes you get a query at the end, because they’re only showing you specifics. I typically remove that so I can see everything. And that’s it. So now what’s going to happen is I’m going to send this URL and a starting location over to fmFlare. And it’s going to open a map in a card window and start to draw those parcels. Now there’s 1000s. So if I zoom in, it should. It should be a little more complete here. Maybe that Yeah, there we go. So now great, we can see parcels but that’s not all. It’s already set up to do. So let’s look at starting a little closer. Let’s look at using the attributes for each parcel. So if I simply check this box Right here, it’s going to take every attribute and render it in a map pop up. And so let me run that again. And this time when I click on a, on a parcel, it’s going to show all of the data for that parcel. It’s too much to even fit on the screen here. Let’s say that I want to make a useful map and not not show all this data, like what I really care about is what do we really care about, let’s say site address, and parcel ID. So if I come here, and instead of showing all properties, if I just, if I just show, just use FileMaker, style, merge tags. And if HTML, you can actually write your own, but you don’t have to, it’ll do basic formatting without that. But you can do this kind of thing. It supports either one. And now when I look at a parcel, popover, it should show just those two fields. And you can start to see how you can make it a much more useful thing. But the best part is that we have the code set up to communicate with FileMaker used to be via FM URL button, now it uses the JavaScript functions perform script in FileMaker. And actually, you can go the other way too, you can send your own data to the map, or you can pan and zoom the map using JavaScript functions. Those are some of the more advanced options you can do here. But let’s say may send data to FileMaker. And I have a script here, that’s just going to show in a dialogue, what is sent. So now what you’re going to see is that when I click on a parcel, I’m going to get a button that allows me, the default is to use JavaScript, and that card window was in the fmFlare file. If you want to just use the fmFlare card windows, you need to, we need to switch it to use the FM URL format. But now it’s passing all that JSON for this feature into FileMaker.
So there are some use cases for this. We have a client that does permits for building permits for homeowners, and they get the paper form or the web form, and they enter to FileMaker. Or people enter it in directly themselves. And it looks up their address. They verify their parcel. And then we can pull in all this data and prefill the parcel ID, the address of the school district, like all that information that an inspector would want to know to make sure they’re going to look at the right place. Or utilities people when they go to mark before you dig or something like that you can the county GIS department is already tracking all that data and we can just pull it in and provide it. So a couple more. Let me just flip through these examples. So here’s the very similar Yeah, almost identical, but for Orange County, California, that was on their open data portal. Here’s one for political districts. Like, who’s your representative? And what? Yeah, What party? They’re from and what? Yeah, like, Where are you, you can find data set like APIs for where you’ll vote. And all of its provided in an ArcGIS data set, because it is based on where you live, or in this case, where you click on the map to learn about that. So, here is an example, just using geo JSON built from, say, your customers in FileMaker. You can, this is the kind of map that Nick was showing us and Peregrine. So, on a given day, they have tickets to go out and do pest control. And because their addresses are verified, and geo coded, he was able to display maps, and these pin colors can be customized, to show. In fact, you can even use graphics, like if you wanted to have a picture of the house as the pin, or something like that. All of that can be customized in the geo JSON, and you can show, say, a service person where to go or a salesperson. Okay, here’s one that looks like it has a tile error. Okay, so you saw how slow those parcels were drawing on the other map. So this solves that by, instead of here, whereas zoom out, and it just says sorry, can’t render it. Here we have a tile layer for when you’re zoomed way out. And then once you zoom in far enough, it switches to a vector layer. This is actually on one of our clients ArcGIS Online accounts, where they, just provide those two options, and it makes it a more useful map for that city that imagine this. You can, sometimes you’ll only get if they don’t have a ArcGIS Server, you might get geo JSON as a file. And you can put a file in a container field here and it will still map it sends the data via JavaScript to the map after it’s loaded here. And you can do it also via a URL like maybe you just want to drop your geo JSON on s3 or your web server or something like that. Let’s see, this is just another city, we’ve already looked at plenty of parcel data. Here’s on I was Google, I just googled bus stops open data. And for some reason Sioux Falls, South Dakota showed up first. So these are all the bus stops in Sioux Falls. Again, just free data pulled real time. The other great thing here is you’re not storing this data. And so the as they may have to look at their terms to see how often they update it. But I know there’s these counties are keeping it up to date. Real Time, every time a parcel gets split or added or, they update their maps, and then the ArcGIS service updates too. So you’re always working with current data. And if Sioux Falls adds a new bus stop, I imagine, as soon as they add it to their system, it’s going to show up here. So more parcel data, I didn’t need so many examples of that. Let’s see this one is sometimes if there’s a token, I have to resubmit it. So that it’s fresh. This one must be a lot of data to it… I think bodies of water… Not gonna render here. We’ll skip that one for now. Okay, and I think the last thing I’m going to show you is the newest feature, which is allowing you to draw your own speed, to create your own spatial data in FileMaker. So, these are just two tools. There’s actually four Five, that FM player supports lines is another one. And, but these are the two most common ones. So, like, here I have, I have just placed a point. And I, you can, again, here’s a custom icon, it’s like a construction worker to show that maybe works gonna happen in that location, and I have it set up to immediately send data to FileMaker. So that you could track this, as it goes, or you could,, have a button to do it at the end if you’re going to if you are going to place multiple points. But just to give you the idea, here’s how to do a polygon. If you wanted someone to draw an area of interest, and then you’re going to get this, this is all geo JSON, you could store it in a text field in FileMaker. And put it back on a map, you could, you could, you could use this and put it on a Google Map. We’re using an open source library here called leaflet. But this is a standard format. So if you had your own ArcGIS account, or you were sending the data to somebody that did, or using Google’s API, you could pass this data and get this feature on any of those kind of maps as well. You can edit so, you can come back reload the feature and change it, you can then get the updated information they stored in FileMaker. You can remove points. And now you’ll get back just what remains. So you can see how this is starting to give FileMaker some geographic information system capability that it certainly doesn’t have natively so. So that’s drawing your own features. Okay, this one is Commissioner districts, I think this one has a geo JSON URL that would load faster, but you get the idea. So why don’t I stop there? Does anybody have any questions for me about how this works? Or how you could use it? Questions about what it could do? When you look at this, it is pretty amazing that it’s happening in FileMaker. Because it’s so graphical. And I’ve got a real quick video here, from just one window in a client solution where they’re using this in. So this is using fmFlare and their own card window and it tracks. For public works like what properties are going to be impacted. And so with a little bit of custom JavaScript added, they can, turn on and off, like select parcels and add points like this. And they save it and it gets stored with that record. And then when they come back, it reloads the map, and they can say, well, we actually didn’t touch this parcel, they could turn it off. And so, simply by tweaking the settings in that script parameter, they’re saying, to show like to like you can show, you can show these map popovers as a tooltip, like on when your mouse hovers, versus when you click on a feature. So they wanted to click to actually select the parcel. And so in their case, we switched to using tooltips to show the data and then when you click, it selects the parcel. And they get to choose the colors and what it looks like that’s just a little bit of CSS that you pass in, and all that can happen. With very minimal web coding anyway, so And all of this is made possible by the new functions in FileMaker, 19, the the JavaScript, it definitely helps, and it opens up new capacity. We were doing this prior to that, and we still can in FileMaker 18, using FM URLs. But there’s limits like the data that you pass via URL can only be so many characters on the windows side. It’s and so, um So you’re more limited. And it’s more difficult to work with, but it’s still supported certain things, like sending data to the map after the map is loaded, like some, if you want to have a map load, and then allow interactions in FileMaker, and allow the map to adjust without kind of like reloading the whole layout, you can do that sort of thing now with the new JavaScript functions. And it’s just a much better user experience, because we used to have to refresh the whole web viewer, or use really hacky methods like hash hashing to, to get the web viewer to see chain, triggers coming from FileMaker.
So you’re more limited. And it’s more difficult to work with, but it’s still supported certain things, like sending data to the map after the map is loaded, like sum, if you want to have a map load, and then allow interactions in FileMaker, and allow the map to adjust without kind of like reloading the whole layout, you can do that sort of thing now with the new JavaScript functions. And it’s just a much better user experience. Because we used to have to refresh the whole web your or use really hacky methods like hash hashing to, to get the web viewer to see change, triggers coming from FileMaker. It really looks neat. Any questions? I want to give Shawn some time to do his part too.
Tim Cimbura: We have pizza coming at noon, approximately, and maybe we’ll just let people get up and get your pizza. And if you have to go over a few minutes, you can just continue talking.
Shawn Krueger: All right, I think my stuff will be not quite as in depth. So we’re just going to go over kind of an overview of this is our basic, our toolkit here at lumen fire. fmIgnite is our main business solution that we customized for a lot of clients like that’s what Paragon is running, that he demoed last month, and just kind of showing the mapping of how we integrate, via fmFlare to other services that we, we have brilliant saying brilliant flows, all things to transfer data here and there. And then on the other side of things, and we’re talking to WordPress websites, using WooCommerce, for online stores. Anyone then just just about any other API you can think of.
I’ve got some screenshots here, so that we’re not as beholden to the demo gods, here’s, I guess, everyone always wants to see the relationship graph. So here’s our fmIgnite. This is updated somewhat since Peregrine. For a while we were using the selector connector model method from Todd Geist, and Jason from see code kind of develop that. And at the time, it was really neat to allow us to do some things, but in the era of card windows, it’s not necessary. And we found, as your solution grows, it slows things down quite a bit. So we’ve gone back to anchor buoy, our first true love for relationship graphs. So just kind of showing some little tips of, the graph gets pretty big. And we tend to do everything kind of vertically. So we’ve got, the FileMaker kind of sticky notes. So we’ve got this number system to jump to a specific section. So if you want to get to the job section of the graph, you open the relationship graph, and you type 14, and it jumps right to that sticky note that says 14. So here, just a view of some of the other anchor sections, and how things are arranged with the buoys off to the right. And then just, there’s the way zoomed out view of everything. So pretty well organized, that helps it so that if any of our developers hop in, they can see what section they’re working on and get to things. It’s a pretty common interface.
And then here, we’re going to go within the solution. We’ve got our admin section. And here we’re in integrations. This is where we connect fmFlare. We’ve got our license key for that. And then underneath here, we’ve got specific integrations within that. So, for GIS mapping, we have a bunch of different services that we can connect to, as Andy mentioned, like, here’s the API keys, that we would store for, for here. And then, other services, some of them require an API key, some don’t. So and then pretty common one is transactional email. So we’ve got Support for sending email via FileMaker smtp. But we don’t like to do that Mandril, SparkPost and Mailgun are three common APIs that we work with. And that in Peregrine’s case, they’re using that to send their customers notifications that, hey, we’re going to be at your site on Tuesday at 10 o’clock. Here’s a picture of your check. And so all that’s going out via email, automatically on schedules, and people get automatic reminders. And then there’s a template to format, the email, puts their logo at the bottom. This one’s pretty simple, you can get as fancier as you want there.
Now, here’s a JavaScript integration that we have called data tables, and I’ll just do a quick demo of this, when they’re adding a new service ticket. They’ve got some 1000 contacts in there and growing all the time. So finding an existing client, in FileMaker, using a portal can be pretty slow to filter that. Data tables is a JavaScript library we show in a webviewer. And we can search and filter on that really quickly. Like if I type, and you see that, quickly filters down. And it’s doing more advanced searching than your native FileMaker. Like, here we have a name, where regular FileMaker search might only find things that start with Shawn, here, it’s finding in the middle of things. So it’s pretty comprehensive search, and then we’ve got basically setup, so when you click on that, it selects that, it’s grabbing the ID of that contact record and setting it, oh, I don’t have a billing address. But there we go. So now I’m set as the contact for that. And kind of how that works under the hood. We need to give that some data. So we’re building a JSON array of all the contacts. And so this is just a view of that for our troubleshooting. Basically, this runs on a schedule on the server to keep this up to date. Or we can update it manually here. But in general, it’s enough up to date to be useful to them. And then, so in our HTML, this is kind of what gathers up all of the things. So it’s, we’re using these kind of wildcards to pull in the CSS, the JavaScript from these other tabs, all into one HTML for the web viewer. So here’s our CSS. And then, this is a JavaScript library, it’s a whole bunch of gobbledygook. I don’t know what it does, I don’t have to know. That’s the beauty of these JavaScript libraries that are well known and vetted. There’s a community out there supporting them. Here, we have our JavaScript functions. And this is where we’re integrating our FileMaker data. So this is grabbing our data from the Data tab that we showed, and then we’re telling it which columns we want to view. And then I should go back to there’s a lot of stuff that is just that you get for free with this JavaScript library that, if this were a portal and FileMaker, I can search on any of these must have some empty records in there. Get back to There we go. But, this, the searching and paging to only load a few records at a time. This can be customized, you can load however many you want. And as you saw in where that example went, but if you have something that is more data than fits in there, the row height automatically expands to fit that. Whereas with the FileMaker portal, it’s just not something you can do. So we get a lot of neat abilities right out of the box that you can maybe hack together with FileMaker but it’s a lot of extra work. Yeah, and then here’s just kind of our troubleshooting area view of that web viewer altogether.
So the other thing that has really helped them is the calendar view, that’s an integration using full calendar.io. It’s another JavaScript library that’s out there. The basic level is free. They have some paid options like Gantt views or whatever. There’s some other custom views that you can get by paying, but a regular calendar view is free. So again, here’s our data that we’re pulling in, it’s an array from our event table. So each thing has a FileMaker, ID, there’s start and end dates. We’ve got some addresses in there, as well. And in this case, we’ve got our HTML, this is where we’re putting in calls to some FileMaker scripts. So what happens when you click on these objects. And this is the older, we’re using the FMP URL with something that, could be updated to the new JavaScript calls to FileMaker scripts, at some point, but at this point, in Peregrine, it’s working, so we haven’t had a need to update that. Again, here’s the, here’s the JavaScript for it, and no idea what any of that means. So yeah, so it’s all it’s all minified. So, it’s not in a way that’s readable, easily, whereas, the source code itself would probably be more readable. And you’d be able to go through that with a little bit of JavaScript knowledge. But, but then, here’s our web viewer view of that all together. So yeah, it’s been really handy. And then, when they, when they click in on something, they get a FileMaker card window with some details, and then they can jump from there to that service ticket, or to the contact record for that technician. Get back to that. Get back a few weeks to get some data in there. But normally, it gives you a card window with some other FileMaker native buttons on there. So it’s a nice thing about the JavaScript is you don’t have to do everything in the JavaScript, you can call up in a FileMaker card window, and then you’ve got all your familiar FileMaker layout buttons and controls that we’re used to.
So, that is kind of the quick covering of the, under the hood, stuff in Peregrine here. there’s in addition to the email notifications, they’re also doing text notifications. and then their customer contact refer record has the preferences for how they like to be contacted, do they? Do they want texts? Do they not want text or they want emails or not? And so the notification scripts will check that and then, send out the appropriate notifications. Their technicians are looking at the calendars and see if Can you show just one of the example scripts like that sending text messages or something? Maybe you can find it. Let’s see. Actually, let me pull up one of the email ones. So our email fmFlare. Again, you’re sending a bunch of parameters. And yeah, this is one of our older scripts, so uses the more list style parameters, but then When we’re sending this to fmFare, then we are using the JSON for parameters. So here we’re setting up the basic what type of email service and method are we doing? See the message itself, I guess we’re already bringing that in. And then we’re, here’s where we’re putting everything together to send to fmFlare. And then we’re gathering up our recipients. We’ve got CC, BCC, any attachments, looping through and adding those. And then, if we’re sending the email client, or SMTP, or Mandrill, or Sparkpost, or MailGun, the different functions are all built in here to, to gather up, this one will go, the subscript will go retrieve the mailgun API token and whatever it needs for that, and come back to here. So we’ve got one place that does that we can call to repeatedly. And then you’re we keep adding to this subscript JSON. So here we’re adding sender name. And so by the time we’re done, then we just have the request made on we’ve got which service which function and then the subscript JSON that we’ve been adding to along the way. And then we call fmFlare with all that JSON, and then we get a response back, and we can parse out. Was it successful? Was there an error we can return an error code to a parent script? So yeah, cool.
Tim Cimbura: Any questions? If not, I want to thank Andy and Shawn for presenting today, giving us a little bit of the behind the scenes on this solution. And I think then we’ll go ahead and have our pizza and call it a day here. Thanks for joining us.

Tim Cimbura – CEO and Software Engineer
Tim is an expert in creating custom business solutions that make businesses more effective, productive, and profitable. He specializes in rapid application development with the Claris platform including FileMaker and WordPress. He also knows Apple macOS technology inside and out.