![]() This sample database can be used by FileMaker developers to help create a customized solution. It is provided free of charge.
This sample database can be used by FileMaker developers to help create a customized solution. It is provided free of charge.
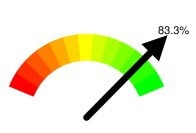
Google provides some fun and out of the ordinary charts you can use to help make a FileMaker dashboard. The “Google O Meter” can display an empty/full gauge or a visual warning. Using the FileMaker web viewer you can build a URL that is sent to Google and returns a chart image.
 Take a look at the example formula for the web viewer below and in the example file:
“http://chart.apis.google.com/chart?chs=” & CHARTDATA::Width & “x” & CHARTDATA::Height &
“&chd=t:” & Int((CHARTDATA::cPercent)*100) &
“&cht=gom&chl=” & Round((CHARTDATA::cPercent)*100;1) &
“%&chtt=”& Substitute(CHARTDATA::Title; ” “; “+”) & /* Title */
“&chts=000000,10” & /* Font color and style */
“&chco=” & CHARTDATA::Colors

