
apm install php-debug
After running that command you’ll need to restart Atom before php-debug will show up. After this there’s a few pieces of information we’re going to need to collect to configure things.
- The IP Address of your virtual machine
- The Path to your site’s public directory from the perspective of your local machine i.e. Local Path
- The Path to your site’s public directory from the perspective of your virtual machine i.e. Remote Path
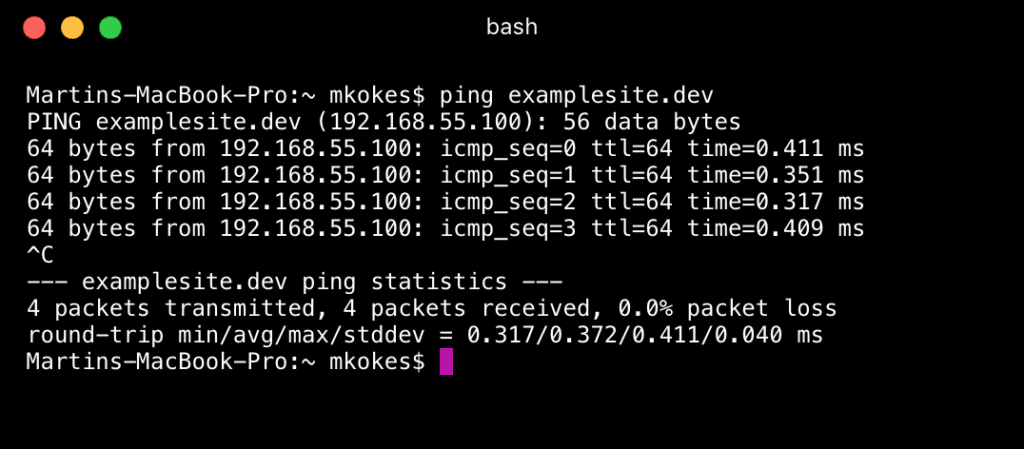
To find the ip address of your VM simply open up a terminal and ping it like you would any other site.
Most of your local path can be found by simply looking at the ‘Site Setup’ page for you site within Pressmatic.
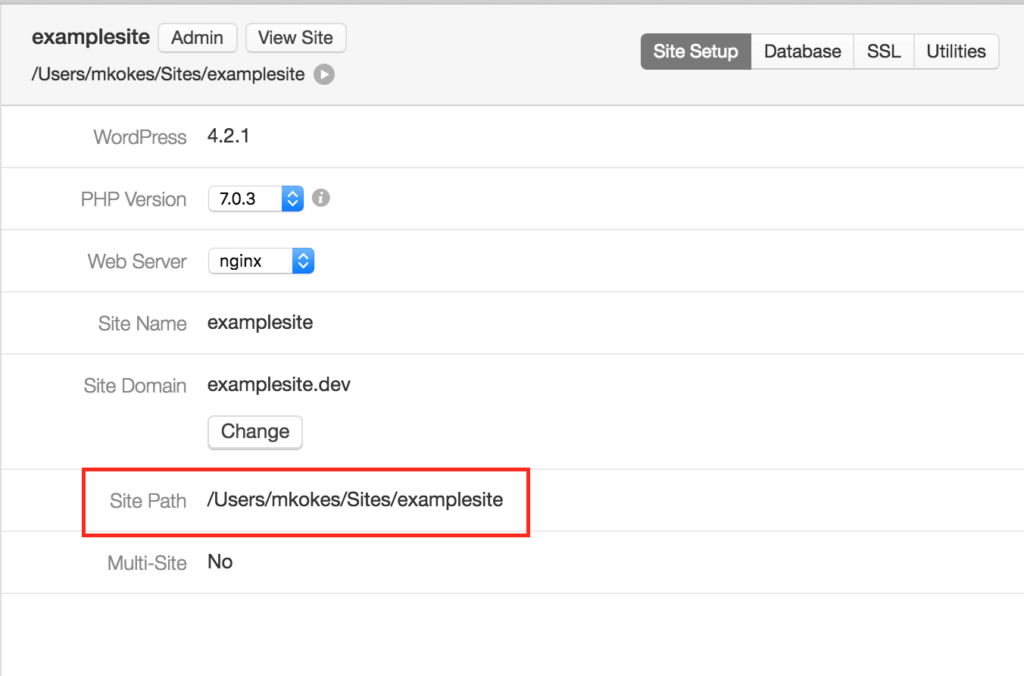
This gets us most of the way there, the actual path that we’ll want to use is the site path as shown above with ‘/app/public’ appended to the end of it. Lastly our remote path will simply be ‘/app/public’.
So to recap here’s what I have for this site’s setup.
- Remote IP Address = 192.168.55.100
- Local Path = /Users/mkokes/Sites/examplesite/app/public
- Remote Path = /app/public
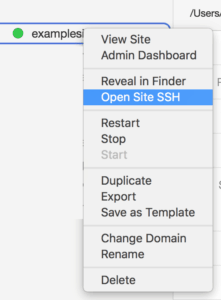
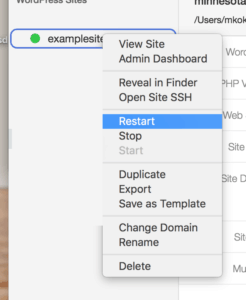
Now let’s use this information and configure Xdebug and php-debug. First up we’ll tackle Xdebug, this requires modifying the php.ini file within your VM the location of the php.ini file is going to vary slightly depending on the version of php you’re currently set to. To begin with from within Pressmatic you’ll want to right click on the site you wish to configure and select ‘Open Site SSH’. This will pop open a terminal window that’s remotely connected to your virtual machine.
By default Pressmatic sites have the nano editor install, but no vim, so if you’re like me and loath nano you’re probably going to want to install vim.
apt-get update

apt-get install vim
Now we can navigate to the php.ini file.
cd /conf/php Within the php folder if you run the ls command you’ll see a folder corresponding to the version of php you’re using. In my case I’m just using the default version 7.0.3. cd into that folder and you’ll see the php.ini file. Go ahead and edit it using Vi.
vi php.ini
Once you have it opened up towards the very bottom of the file you’ll see the section that corresponds to Xdebug. it’ll look something like this…
[Xdebug]
zend_extension = /opt/php/7.0.3/lib/php/extensions/no-debug-non-zts-20151012/xdebug.so
xdebug.remote_enable=1
xdebug.remote_connect_back=On
xdebug.remote_port="9000"
xdebug.profiler_enable=0
You’ll want to change it so that it looks like the example below, note that I’m using the remote IP that we found earlier.
[Xdebug]
zend_extension = /opt/php/7.0.3/lib/php/extensions/no-debug-non-zts-20151012/xdebug.so
xdebug.remote_enable=1
xdebug.remote_connect_back=On
xdebug.remote_port="9000"
xdebug.profiler_enable=0
xdebug.remote_host=192.168.55.100
xdebug.remote_handler=dbgp
xdebug.remote_mode=req
xdebug.remote_autostart=true
Now to make sure our new settings are loaded into the configuration you’ll want to right click on your site and select restart.
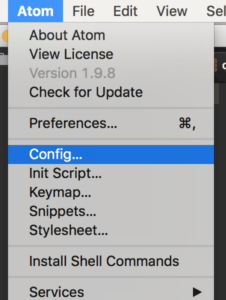
Let’s go ahead and configure Atom/PHP-Debug now, click on Atom in the top menu and go to config. This will open up Atom’s config.cson file.
Find the section of the config file that contains the php-debug. We’re going to need to specify the port that xdebug is running on along with the paths to the local and remote directories.
"php-debug":
ServerPort: 9000
PathMaps: [
"/remote/path;/local/path"
"/app/public;/Users/mkokes/Sites/examplesite/app/public"
]
As seen above the remote path comes first followed by a semicolon then your local path. That’s it! You should now be up and running with Atom+Xdebug!
A few things I think I should mention in closing, you’ll need to perform this setup for each of your Pressmatic sites separately. Essentially they’re all separate machines so they each have their own separate php configurations. Within your Atom config.cson file you’ll want to add a line to you PathMaps for each of the sites you’re wanting to use xdebug on. Lastly when you change php version on a site you’re also changing php.ini files and if you change back to a version you were previously using your xdebug changes will be overwritten, so as a rule of thumb anytime you change php versions you’re going to need to reconfigure xdebug.

Tim Cimbura – CEO, CFO and Solution Engineer
Tim is an expert in creating custom business solutions that make businesses more effective, productive, and profitable. He specializes in rapid application development with Claris FileMaker, Laravel, and WordPress. He also knows Apple macOS technology inside and out.